Diagnostics and job management
Monitoring and managing jobs
Running the processASKAP.sh script will also create two scripts that are available for the user to run. These reside in the tools/ subdirectory, and are tagged with the date and time that processASKAP.sh was called. Symbolic links to them are put in the top level directory. These scripts are:
reportProgress.sh – (links to tools/reportProgress-YYYY-MM-DD-HHMMSS.sh) This is a front-end to squeue, showing only those jobs started by the most recent call of processASKAP.sh. It can take a few options:
-v : provides a list of the jobs along with a brief description of what that job is doing.
-r : shows only the jobs that are running (useful if a lot of jobs are waiting in the queue)
-c : runs with the -M flag to show jobs for a different cluster to the one on which the script is run
killAll.sh – (links to tools/killAll-YYYY-MM-DD-HHMMSS.sh) This is a front-end to scancel, providing a simple way of cancelling all jobs started by the most recent call of processASKAP.sh. It will not kill the launch script that runs at the end of a pipeline run to gather stats and re-run processASKAP.sh (although note the -x option below).This also has a few options:
-x : prevent the launch script from re-running the pipeline next time round
-p : kill only the pending jobs (with the exception of the launch script) - those jobs that are running are left alone to complete
-c : runs with the -M flag to show jobs for a different cluster to the one on which the script is run
In each of these cases, the date-stamp (YYYY-MM-DD-HHMMSS) is the time at which processASKAP.sh was run, so you can tie the results and the jobs down to a particular call of the pipeline.
If you have jobs from more than one call of processASKAP.sh running at once (generally not advised!), you can run the individual script in the tools directory, rather than the symbolic link (which will always point to the most recent one).
The list of jobs and their descriptions (as used by reportProgress.sh) is written to a file jobList.txt (which is a symbolic link, linking to slurmOutput/jobList-YYYY-MM-DD-HHMMSS.txt). There are symbolic links created in the top level directory (where the script is run) and in the output directory.
For future reference, the configuration file is also archived in the slurmOutput directory, with the timestamp added to the filename. This will allow you to go back and see exactly what you submitted each time.
Resource diagnostics
Each of the individual askapsoft tasks writes information about the time taken and the memory used to a “stats” file. The information includes the job ID, the number of cores used, a description of the task, along with an indication of whether the job succeeded (‘OK’) or failed (‘FAIL’). For distributed jobs, a distinction is made between the master process (rank 0) and the worker processes, and for the workers both the peak and average memory useage are reported. This is important for tasks like cimager where there are clear differences between the memory usage on the master & worker nodes.
These files are progressively updated as jobs complete, and so can be examined as the pipeline run progresses.
Both ASCII (formatted into columns) and CSV files are created, placed in the top-level directory and labelled with the same time-stamp as above - stats-all-YYYY-MM-DD-HHMMSS.txt (or .csv). Here is an excerpt of a typical stats file:
  JobID    nCores                                       Description   Result      Real      User    System    PeakVM   PeakRSS                StartTime
4460004         1                                    split_BPCALB00       OK       8.9      0.73      1.08       487       136  2018-06-08T20:21:24,630
4460005         1                                 flag_BPCALB00_Dyn       OK     10.33      9.34      0.44       470       120  2018-06-08T20:21:39,974
4460077         1                              applyBP1934_BPCALB00       OK     21.91     21.27      0.53       483       146  2018-06-08T20:47:30,309
4460113         1                                      split_F00B00       OK    544.95     64.02    149.75       531       181  2018-06-08T20:21:42,092
4460114         1                                    applyBP_F00B00       OK   3119.34   3060.18     51.39       483       146  2018-06-08T20:47:30,310
4460115         1                                   flag_F00B00_Dyn       OK   1469.36   1375.93      64.4       471       121  2018-06-08T21:39:42,799
4460116         1                                        avg_F00B00       OK    143.78     85.39      41.1       540       175  2018-06-08T22:04:22,974
4460117         1                                 flagAv_F00B00_Dyn       OK     42.18     37.79      1.64       406        56  2018-06-08T22:06:57,483
4460118       145                           contSC_F00B00_L0_master       OK    308.06    289.86     17.97      6379      4002  2018-06-08T22:07:56,605
4460118       145                       contSC_F00B00_L0_workerPeak       OK    308.06    289.86     17.97      4561      2466  2018-06-08T22:07:56,605
4460118       145                        contSC_F00B00_L0_workerAve       OK    308.06    289.86     17.97    2158.8    1541.2  2018-06-08T22:07:56,605
4460118       145                           contSC_F00B00_L1_master       OK    736.05    605.89     129.9      7160      4002  2018-06-08T22:18:44,012
4460118       145                       contSC_F00B00_L1_workerPeak       OK    736.05    605.89     129.9      5577      2466  2018-06-08T22:18:44,012
4460118       145                        contSC_F00B00_L1_workerAve       OK    736.05    605.89     129.9    2222.0    1541.2  2018-06-08T22:18:44,012
Upon completion of the pipeline, this information is also presented graphically, in a PNG image (statsPlot-YYYY-MM-DD-HHMMSS.png, which is put in both the top-level directory and the diagnostics directory. Here is an example:
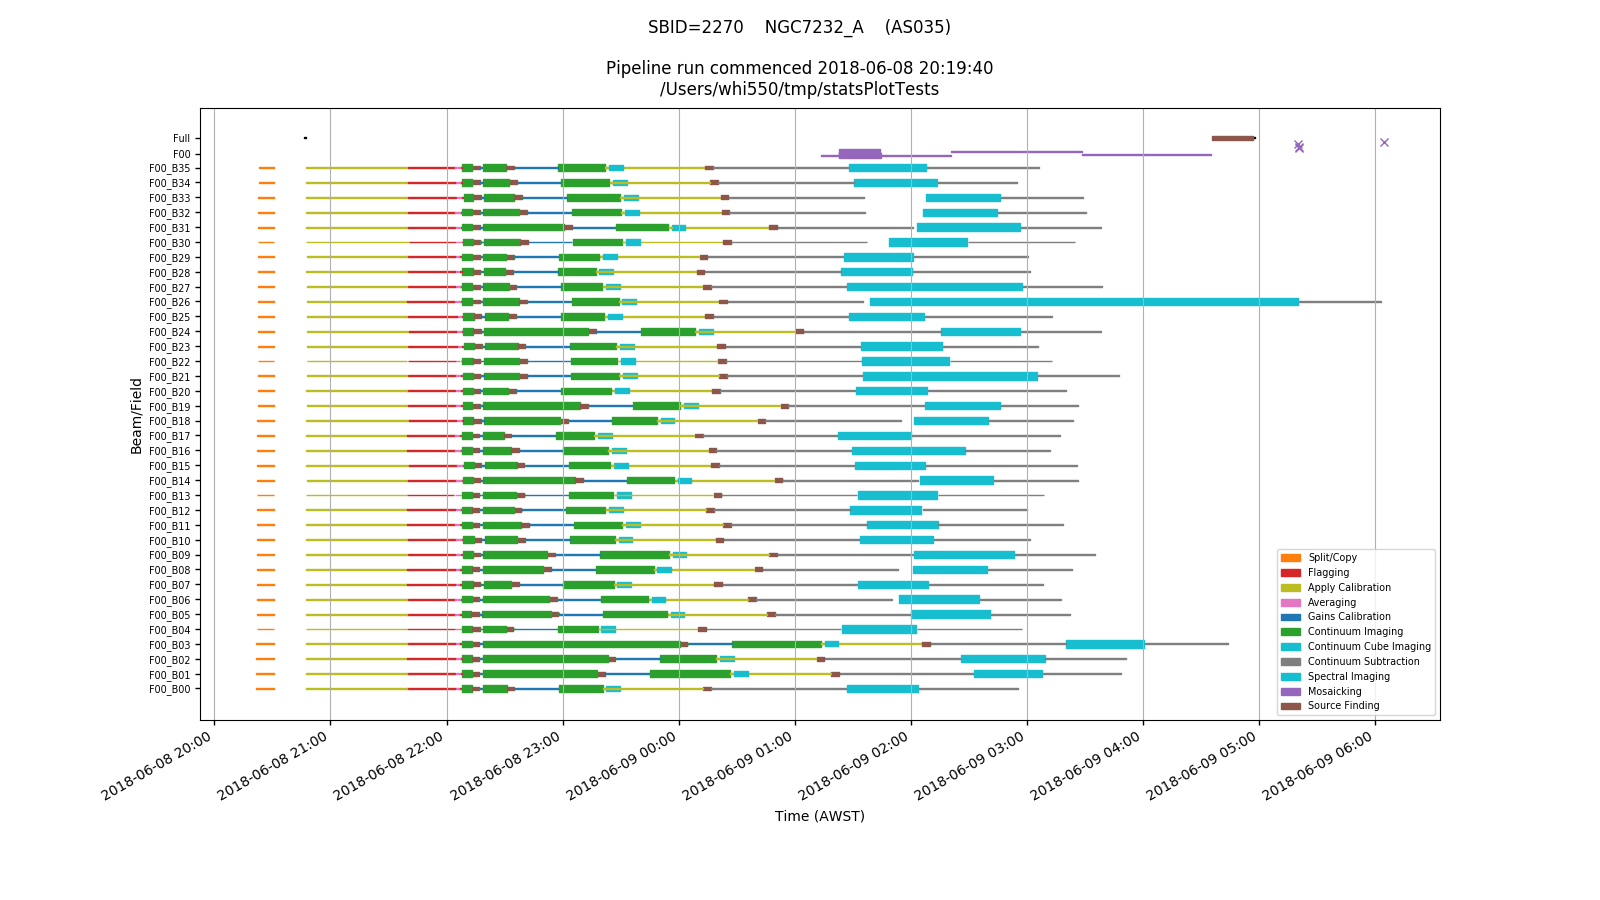
Each row in the plot corresponds to a single beam/field combination, with mosaicking jobs for a given field getting their own row, and mosaicking and source-finding jobs for the overall observation getting a further row (at the top).
Each type of job has its own colour, and the width of the line for each job indicates the number of cores used. Jobs that fail are represented by crosses at the start time.
Overall pipeline control
A further key set of files are the pipeline control parsets. These are ParameterSet files, that are used to record the state of jobs launched by the pipeline, their slurm job IDs, and the progress of particular stages (replacing the former use of checkfiles). These are kept in the pipelineControl directory, and there is one for each field/beam combination, one for each field alone, and one for the ‘base’ level jobs.
It is not intended that this file be accessed outside of the pipeline processes, although the shell script pipelineControl.sh does allow interactions (and is used by the pipeline scripts to do so).
There are several types of parameters present:
<param> - the job name, similar to that used in the stats files. This has one of four states:
todo: job is pending
running: job is currently running (or has timed-out or been cancelled)
ok: job completed successfully
fail: job completed with errors
check.<param> - a checkpointing parameter, used to indicate a particular step in the pipeline workflow has completed successfully
jobid.<param> - the slurm job ID corresponding to the job <param>. When the job completes this should be removed from the parset.
fieldXX.beamXX (where XX indicates the numerical count for field or beam) - a special parameter intended to be used to stop processing on a particular beam should a QA check fail. This is not yet fully utilised, but the flags are present. Relevant states are either ‘todo’ or ‘stop’.
The states of the <param> values, along with the stats file content, are used to determine whether a pipeline needs to be restarted (see How to run the ASKAP pipelines).
When a pipeline run completes, the pipelineControl directory is copied to a directory named with the timestamp, then tarred up. When the final pipeline run finishes (ie. no more processing is required), the pipelineControl/ directory is removed.